E-commerce Behavioral Analysis
The same 1,438-person IoB survey read as commercial data — platform behavior, Diwali seasonality, and what actually drives people to buy
A published IoB paper and extended data analysis from the behavioral psychology research track. The pan-India survey of 1,438 consumers had commercial signals in it from the start: platform-specific purchase triggers, Diwali seasonality, demographic spend patterns, and how session depth on social media correlates with purchase intent.
At a glance
The Story
Survey Design — Platform-Behavior Mapping
The same 30-question consumer behavior survey used for the IoB research paper had enough commercial specificity in it to be read separately. The questions captured not just platform usage but product categories, purchase frequencies, and brand interaction types — which made the dataset useful for e-commerce intelligence, not just behavioral research.
Survey Design Parameters
| Dimension | Detail |
|---|---|
| Questions | 30 |
| Geography | Pan-India |
| Duration | January 2021 – March 2022 (14 months) |
| Collection method | Social media distribution (Instagram, WhatsApp, LinkedIn) |
| Age groups | Teen (11–19) · Adult (20–40) · Mature (40+) |
| Key variables | Platform, screen time, product category, purchase frequency, spend range |
1,438 Responses — Commercial Signals in Raw Data
After 14 months, 1,500 responses were collected and 1,438 verified. Initial data cleaning and exploratory analysis revealed immediate commercial signals: November dominated purchases (13.64%), adults aged 20–24 peaked at 9.116% of all orderers, and 78.28% of respondents spent over ₹4,000 per order.
Raw Dataset — Commercial Summary
| Metric | Value |
|---|---|
| Total collected | 1,500 |
| Verified responses | 1,438 |
| Adult (20–40) share of respondents | 65% |
| Adult share of total orders | 72.36% |
| Peak order age group | 20–24 years (9.116%) |
| Respondents spending >₹4,000/order | 78.28% |
| Peak purchase month | November — 13.64% (Diwali effect) |
IoB Paper Published — Platform Influence Confirmed
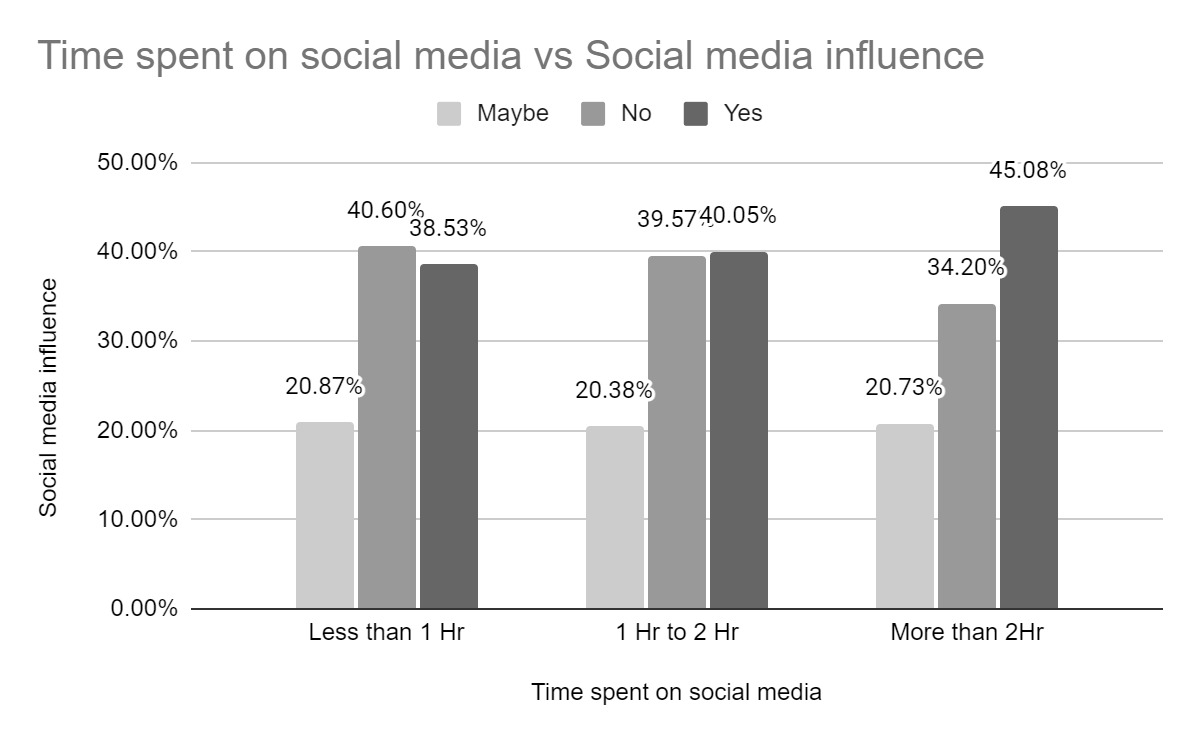
The academic paper confirmed the core thesis: social media time directly scales purchase influence. >2 hour users were 45.08% buy-influenced, vs 38.53% for <1 hour users. Instagram led all platforms at 75% average engagement. The paper gave the dataset academic credibility — but the commercial intelligence embedded in the raw data was still untapped.
CRC Press — IoB Book ChapterPurchase Influence by Time on Social Media
E-commerce Lens — Segmenting by Platform x Demographic
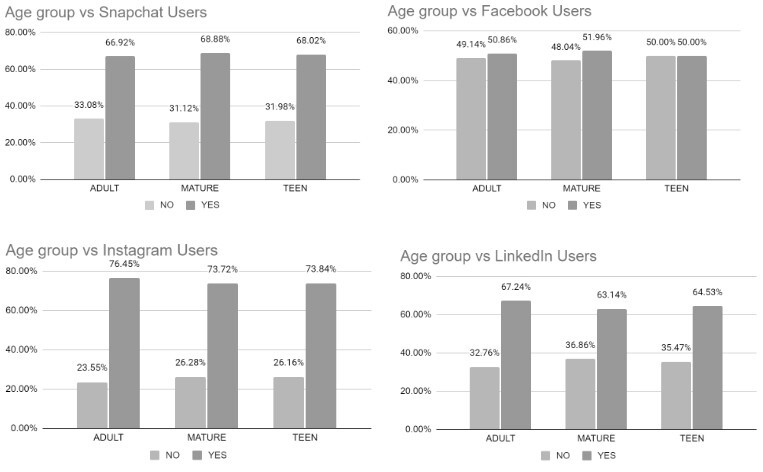
Extended analysis beyond the paper scope. Segmented the dataset by product category, platform, and demographic to surface commercial patterns. Key insight: Instagram is the dominant discovery platform for adults, but conversion behavior differs by age group. Mature users (40+) show 73.72% Instagram engagement but lower impulse purchase rates than Adults.
Seasonal & Category Intelligence — Diwali as a Planning Anchor
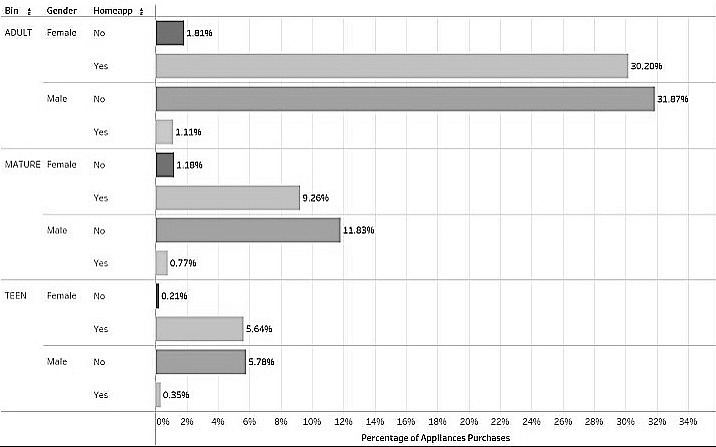
Diwali (November) accounts for 13.64% of annual online orders — nearly 2× the average monthly rate. Home appliances show a strong gender × age interaction: adult males exhibit 31.07% direct purchase intent (platform-uninfluenced), while adult females show 30.20% platform-influenced discovery behavior. These patterns directly inform inventory timing, ad-spend calendars, and creative strategy.
Seasonality & Spend Intelligence
| Signal | Value | Commercial Implication |
|---|---|---|
| November peak | 13.64% of annual orders | Double ad-spend budget in Oct–Nov; run Diwali-specific campaigns |
| Adult spend rate | 72.36% of all orders | Primary acquisition target: 20–40 age bracket |
| High-spend segment | 78.28% spend >₹4,000/order | Premium product placement is viable; AOV optimization focus |
| Peak order age | 20–24 years (9.116%) | New-grad cohort: highest intent, best LTV growth opportunity |
| >2hr influence lift | +6.55pp vs <1hr | Retargeting after 2+ session exposure maximizes conversion probability |
Behavioral Framework for E-commerce Strategy
The behavioral patterns from 1,438 real consumer responses now form an actionable commercial framework: use platform time as the primary segmentation variable for targeting; plan inventory and budgets around the November Diwali anchor; segment creative by gender (discovery vs. direct intent); and prioritize 20–24 year olds as the highest-ROI acquisition cohort. Research that began as academic behavioral profiling became a commercial intelligence asset.
Published Papers
Analytical Study on Consumer Social and Behavioral Psychology and Its Influence on Online Purchasing
CRC Press — Internet of Behaviors (IoB) Book Chapter · 2023
Parth P. Rainchwar · Rishikesh S. Mate · Soham M. Wattamwar · Shilpa Sonawani · Aditya Gaisamudre
DOI: 10.1201/9781003388722Pan-India survey of 1,438 consumers mapping how social media platform usage, time online, and age group influence online purchasing decisions. Applies the Internet of Behaviors (IoB) framework to uncover commercial behavioral signals across three demographic cohorts.
72.36%
Adult Share of Orders
75%
Instagram Influence Avg
45.08%
>2hr Social Media → Buy