Behavioral Psychology
From a lockdown certification to three published papers — cognitive decision-making, nutritional psychology, and consumer behavior
A three-year research arc that started with Yale and Wesleyan psychology certifications during COVID, got a hard push from the Domino's data breach, and ended with three published papers: cognitive decision-making (Springer IACC 2021), nutritional psychology with 98% ML accuracy (Springer ICEI 2022), and online consumer behavior under the Internet of Behaviors framework (CRC Press 2023).
At a glance
The Story
The Spark — Psychology Certifications
During COVID lockdown I found myself with time and curiosity. Two courses — Introduction to Psychology (Yale via Coursera) and Social Psychology with Honors (Wesleyan via Coursera) — changed the way I read people. The concepts of social influence, cognitive biases, and behavioral conditioning explained everything around me.
Yale + Wesleyan CertificationsBehavioral Theory — CBT and Freud
B.F. Skinner's Cognitive Behavioral Theory gave me a structure for understanding decision-making in everyday contexts — food, money, digital behavior. Freud's psychodynamic perspective added a different layer: the unconscious motivations behind consumer behavior, social media use, and herd mentality.
The Domino's Signal — 13 Crore Records Exposed
In May 2021, the Domino's India data breach leaked approximately 13 crore customer records — order histories, addresses, phone numbers, delivery patterns. College-age users had distinct, repeated consumption patterns nobody thought they were broadcasting. The breach made visible what was always happening silently. This was the catalyst.
Economic Times — Domino's Data Breach ReportPaper 1 — Designing the Cognitive Questionnaire
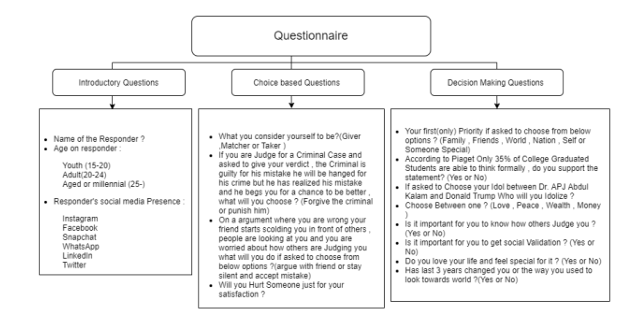
Inspired by the Domino's signal and Skinner's behavioral theory, I designed a three-section questionnaire to map how people make decisions. The survey ran for exactly 7 days — May 4 to May 10, 2021 — targeting youth (15–20), adults (20–24), and millennials (25+) across social media platforms.
Paper 1 — Questionnaire Taxonomy
| Section | Question Type | Sample Questions |
|---|---|---|
| Introductory | Demographic | Name · Age group (Youth/Adult/Millennial) · Social media platforms used |
| Choice-Based | Behavioral Scenario | Giver/Matcher/Taker self-ID · Criminal forgiveness scenario · Argument behavior |
| Decision Making | Cognitive Preference | First priority (Family/Friends/World/Nation/Self) · Choose Love/Peace/Wealth/Money · Social validation importance |
Paper 1 Published — Springer IACC
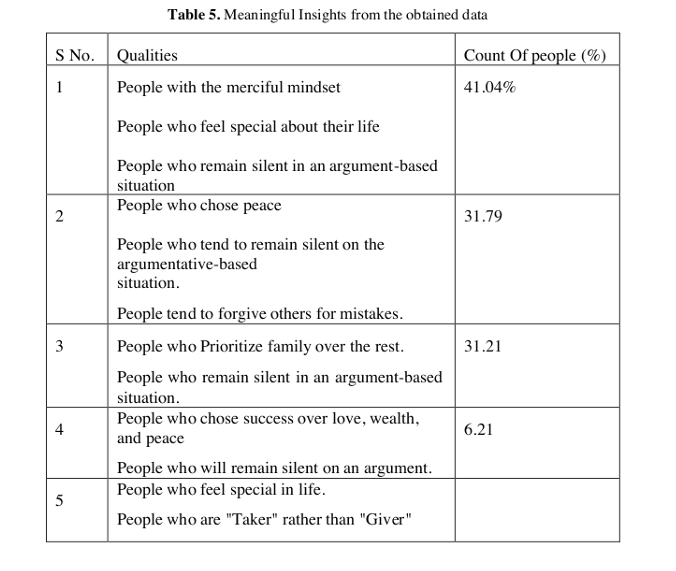
The cognitive decision-making paper was published in the International Advanced Computing Conference proceedings (Springer CCIS). ML algorithms classified respondents into 5 distinct behavioral clusters. The largest cluster (41%) showed the merciful-silent type: people who forgive, stay quiet, and feel special about their lives. COVID had shifted values — family rose above success in measurable ways.
Springer IACC 2021 — Paper 1Table 5 — Meaningful Insights from Obtained Data
| Cluster | Behavioral Profile | % of Respondents |
|---|---|---|
| 1 | Merciful mindset · Feels special about life · Stays silent in arguments | 41.04% |
| 2 | Chooses peace · Stays silent · Forgives others' mistakes | 31.79% |
| 3 | Prioritizes family above all · Stays silent in arguments | 31.21% |
| 4 | Chooses success over love/wealth/peace · Stays silent | 6.21% |
| 5 | Feels special in life · Taker rather than Giver | — |
Cluster Distribution — % of Survey Respondents
Paper 3 — Designing the Consumer Behavior Survey
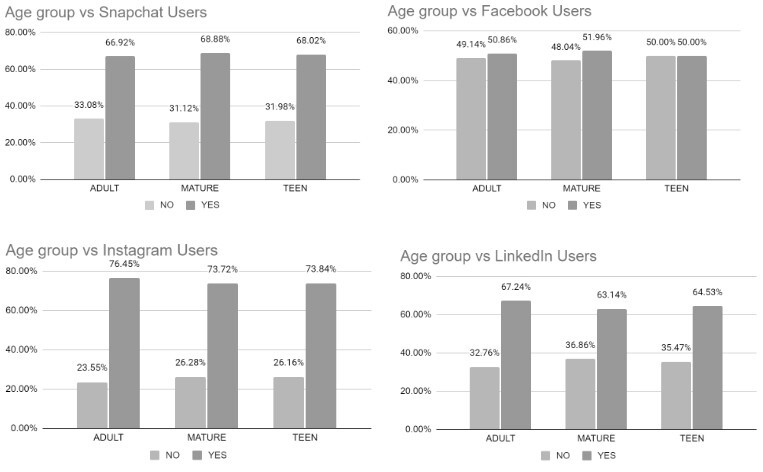
Concurrently with Paper 1 publication, I began designing a 30-question survey to map how social media usage drives online purchasing decisions across India. The survey ran for 14 months. Three age cohorts: Teen (11–19), Adult (20–40), Mature (40+). Out of 1,500 collected, 1,438 were verified.
Paper 3 — Survey Scope
| Attribute | Value |
|---|---|
| Questions | 30 |
| Geography | Pan-India |
| Survey window | January 2021 – March 2022 (14 months) |
| Responses collected | 1,500 |
| Responses verified | 1,438 |
| Age cohorts | Teen (11–19) · Adult (20–40) · Mature (40+) |
| Distribution platforms | Instagram · WhatsApp · LinkedIn · Facebook |
Paper 2 — Nutritional Psychology Survey
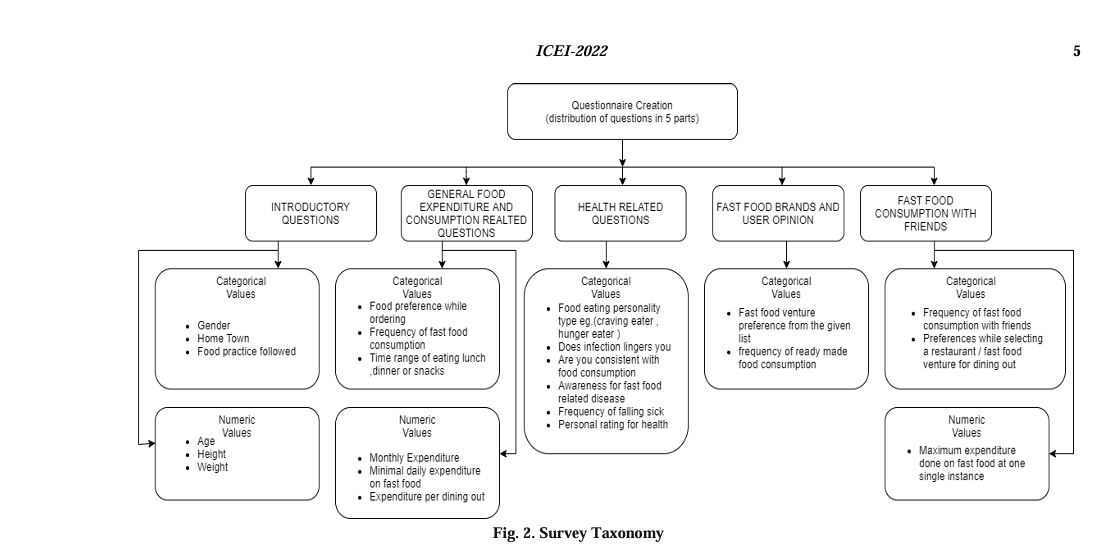
During COVID lockdown, I re-administered an existing dietary habit survey to the MIT-WPU engineering cohort I had been tracking. The pandemic had just reshaped eating behavior on campus and the data confirmed it. This second wave of responses, layered on top of the 2018–2019 baseline, created a before-and-after dataset that would later be the backbone of the nutritional psychology paper.
Paper 2 — Survey Scope
| Attribute | Value |
|---|---|
| Institution | MIT-WPU School of Engineering |
| Sample size | 150+ students |
| Age range | 19–22 years |
| Gender split | 71.21% male · 28.78% female |
| Collection window | 2018–2019 baseline + 2020 post-COVID wave |
| Residence | 65% hostel · 33% Pune locals · 52% metro cities |
Paper 2 Published — Nutritional Psychology, 98% Accuracy
Published in the Springer ICEI 2022 proceedings. The nutritional psychology paper analyzed dietary shifts in MIT-WPU engineering students across a 2018–2020 window — pre and post-COVID. Decision Tree on sickness frequency hit 98% accuracy. Random Forest on BMI hit 96.53%. Pre-COVID, 50% ate healthy. Post-COVID, that rose to 83%+.
Springer Nature Singapore — ICEI 2022Respondent Demographics
| Attribute | Value |
|---|---|
| Age range | 19–22 years |
| Male / Female | 71.21% / 28.78% |
| From Pune (local) | 33% |
| From metro cities | 52% |
| Hostel students | 65% |
| Survey period | 2018–2020 (Pre & Post COVID tracked) |
| Sample size | 150+ MIT-WPU School of Engineering students |
Paper 2 — Model Accuracy Breakdown
Five prediction targets were tested using classification and regression models. The headline 98% accuracy (Decision Tree on frequency of falling sick) validated the hypothesis that behavioral signals from food patterns could predict health outcomes with a degree of precision traditional dietary surveys never achieved.
Table 2 — Classification Model Results
| Target | Model | Accuracy |
|---|---|---|
| BMI Category | Decision Tree | 83.26% |
| BMI Category | Multinomial Bayes | 83.72% |
| Frequency of Falling Sick | Decision Tree | 98.00% |
| Frequency of Falling Sick | Gaussian Bayes | 97.82% |
| Infection Lingering | Decision Tree | 86.04% |
| Infection Lingering | Multinomial Bayes | 90.69% |
| Pre/Post-COVID Food Schedule | Decision Tree | 79.06% |
| Food Quality Preference | Multinomial Bayes | 79.06% |
ML Model Accuracy by Target Variable
Paper 3 Published — IoB Consumer Psychology
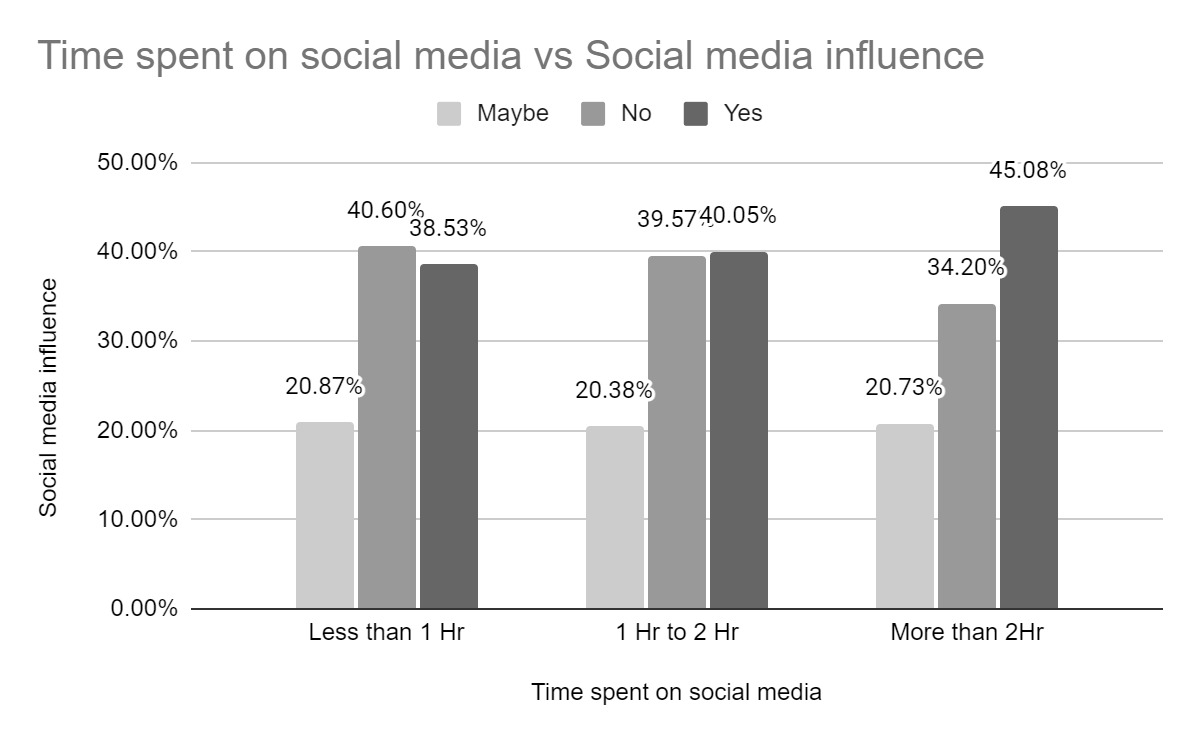
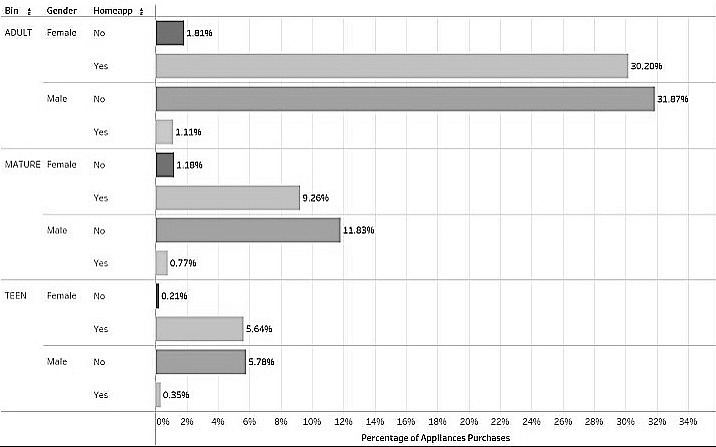
The paper that brought the three-year track together. The 1,438-person pan-India survey on social media and purchasing behavior confirmed most of what the earlier work had pointed toward. Adults (20–40) drove 72.36% of all orders. Instagram dominated at 75% average. Time on social media had a direct gradient effect — more time correlated with more purchases.
CRC Press — Internet of Behaviors Book ChapterPaper 3 — Key Survey Statistics
| Metric | Value |
|---|---|
| Responses collected / verified | 1,500 / 1,438 |
| Survey period | January 2021 – March 2022 |
| Survey questions | 30 |
| Geography | India (pan-India respondents) |
| Teen (11–19) share | 11.97% |
| Adult (20–40) share | 65% |
| Mature (40+) share | 23.03% |
| Adult share of total orders | 72.36% |
| Peak age for orders | 20–24 years (9.116%) |
| Respondents spending >₹4,000/order | 78.28% |
| Peak purchase month | November (Diwali season) — 13.64% |
| Instagram avg interaction | 75% |
One Narrative, Three Papers
The three-year arc from the Yale certification to the published IoB paper — cognitive decision-making (Springer IACC 2021), nutritional psychology (Springer ICEI 2022), and consumer behavior under the IoB framework (CRC Press 2023). Three separate surveys, three different scales of analysis, one consistent thread: behavioral data is measurable and interpretable with the right methodology.
Published Papers
Machine Learning-Based Psychology: A Study to Understand Cognitive Decision-Making
Springer International Publishing — CCIS (IACC 2021) · 2021
Parth Rainchwar · Soham Wattamwar · Rishikesh Mate · Chirag Sahasrabudhe · Varsha Naik
DOI: 10.1007/978-3-030-95502-1_14Applied machine learning algorithms to a custom 3-section questionnaire on cognitive decision-making, mapping respondents across youth (15–20), adult (20–24), and millennial (25+) age groups into distinct behavioral clusters.
41.04%
Cluster 1 — Merciful Mindset
31.79%
Cluster 2 — Peace Seekers
31.21%
Cluster 3 — Family First
Presentation Certificate

Machine Learning for Prediction of Nutritional Psychology, Fast Food Consumption and Its Impact on Students
Springer Nature Singapore — LNEE (ICEI 2022) · 2022
Parth P. Rainchwar · Rishikesh S. Mate · Soham M. Wattamwar · Dency R. Pambhar · Varsha Naik
DOI: 10.1007/978-981-99-4634-1_80Multi-model ML study analyzing the relationship between fast food consumption, BMI, and sickness in college students. Five prediction targets tested. Pre-COVID vs Post-COVID eating behavior tracked explicitly.
98%
Sickness Prediction (Decision Tree)
96.53%
BMI Prediction (Random Forest)
83%+
Post-COVID Healthy Eating
Analytical Study on Consumer Social and Behavioral Psychology and Its Influence on Online Purchasing
CRC Press — Internet of Behaviors (IoB) Book Chapter · 2023
Parth P. Rainchwar · Rishikesh S. Mate · Soham M. Wattamwar · Shilpa Sonawani · Aditya Gaisamudre
DOI: 10.1201/9781003388722Final synthesis applying B.F. Skinner's CBT to digital consumer behavior. 30-question survey across India mapping how social media platform usage, time online, and age group influence online purchasing decisions under the Internet of Behaviors framework.
72.36%
Adult Share of Orders
75%
Instagram Influence Avg
45.08%
>2hr Social Media → Buy